Hello everyone!
After a very busy week of dealing with hurricanes Marco and Laura, I decided to use some of my downtime to explore the world of geospatial data and mapping. It didn’t take long before I saw a tweet that gave me inspiration for a project.

I’ve been following hurricanes closely since 2017 and distinctly remember covering both Harvey and Michael, along with other Gulf of Mexico storms including Nate and Irma. It’s pretty clear even from the picture in the tweet above that a substantial swath of the Gulf of Mexico has seen very minimal impacts, if any, from these three storms. But I figured that examining just how much of the coastline did see impacts, and how severe those impacts were, would make for an interesting GIS challenge.
The first step was to download relevant data. You can get nice shapefiles (that’s the type of file used to store certain types of geographical data) that display state/country borders, population centers, and coastlines from Natural Earth.

Downloading those shapefiles and tweaking the display settings a bit gives a pretty nice basemap. I’m not a GIS wizard by any stretch of the imagination so I bet there are ways to make this look nicer, but I had what I wanted: a map on which to plot my hurricane data.
The next step of the project was to download some wind data from each of the hurricanes of interest. The problem here is that to my knowledge there’s no dataset available in GIS form that contains interpolated wind values from actual weather stations. There are a number of reasons for this including our relatively sparse network of high-quality weather stations, the tendency of weather stations to get knocked offline or destroyed in major hurricanes, and the challenge of doing a representative interpolation of a few discrete wind observations over a heterogeneous surface.
So without “ground truth” data, I decided to just use the initial wind radii information produced by the NHC for each advisory. This is an overestimate of the winds actually observed on the ground in any given location, but that’s what was easily available so off I went.

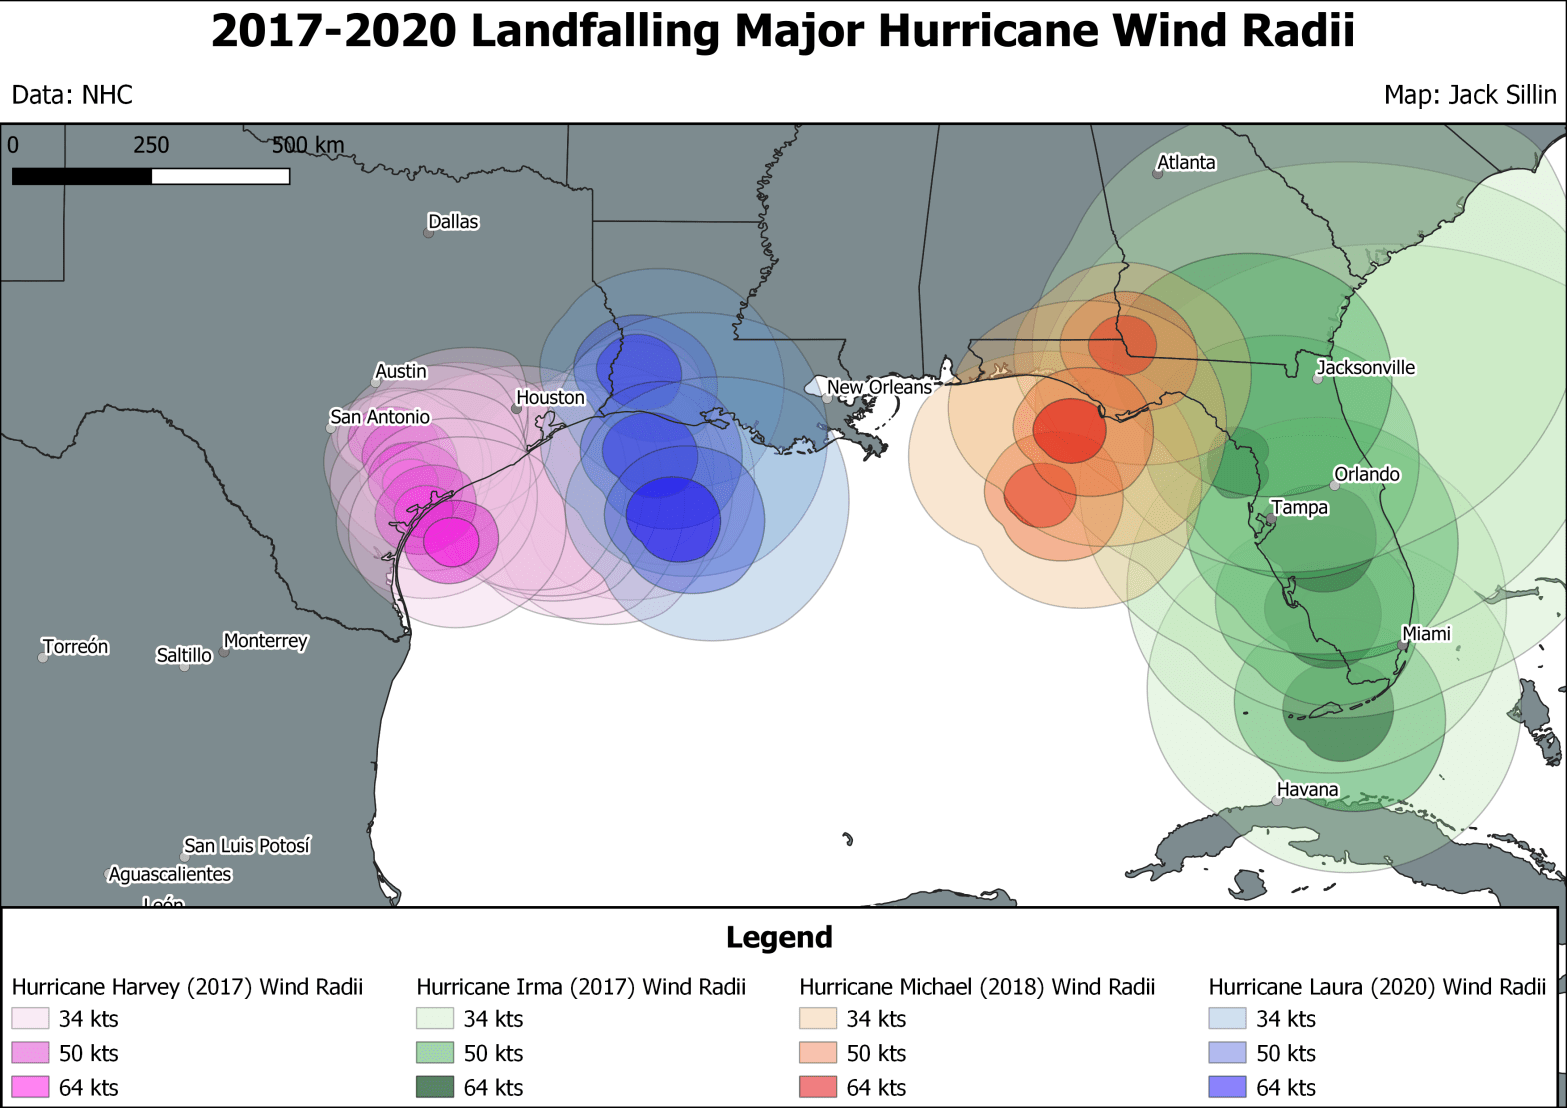
I started off by just plotting the wind radii from the advisory before landfall for the three storms in The Weather Channel tweet (Harvey, Laura, and Michael). That seemed to give a decent guesstimate for which areas had been impacted by tropical storm- or hurricane-force winds. Unfortunately, no wind swath data is available for >100kt winds (the threshold for a Major Hurricane). That said, major-hurricane-force winds are confined to a very very small area in the “right-front quadrant” of a storm, and thus impact a significantly smaller area than a given storm’s hurricane-force winds.
By now, can anyone figure out the glaring omission in both the tweet and my graphic? Major Hurricane Irma, which made landfall in the Florida Keys as a Category Four storm and again in southwestern Florida as a Category Three storm is not mentioned! Of course this had to be fixed.

For the final plot, I included Irma as well as wind radii for a couple advisories after each storm’s landfall.
All in all, this seems to give a pretty decent idea about which parts of the Gulf Coast were impacted by each storm in the last few years. Very little of the Gulf Coast has seen hurricane-force winds let alone major-hurricane-force winds, but most of the coastline has seen winds of tropical storm-force or greater (except a very small portion of southeastern Texas. The New Orleans area didn’t see TS-force winds from these storms, but did from Nate in 2017 and Cristobal in 2020).
The biggest issue with drawing conclusions about hurricane impacts based on this plot is that it only shows estimated winds, not surge or rain. A quick look through NHC’s GIS archive turned up surge forecast data but not rain forecast data. Alas this data is subject to a big caveat which is that it is merely the best forecast available before the storm hit, not necessarily how much surge actually occurred. But still, it’s a baseline to use for purposes of rough comparison and to practice working with a bit of GIS “raster” (a different format than shapefile) data.

Because surge only impacts areas right near the coast, it’s a bit hard to see on this map which is fairly zoomed-out to give a general look at the whole Gulf Coast.
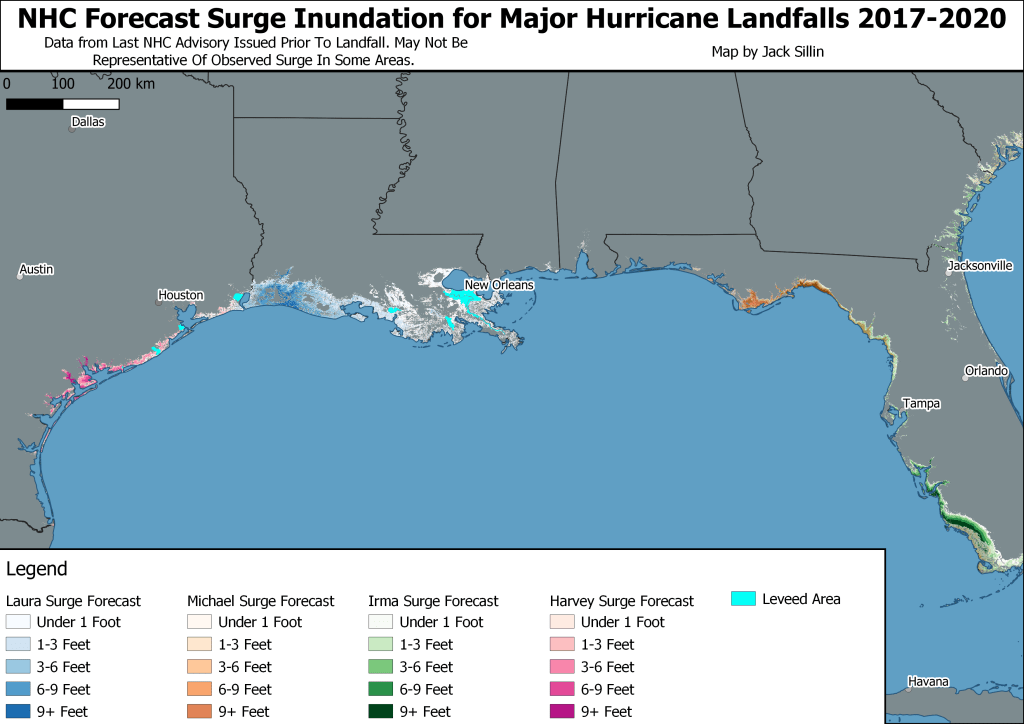
This version of the map zooms in a little bit to hopefully make the surge a bit more visible. Either way, it’s clear that most of the Gulf Coast has had to think at least somewhat about storm surge in the past few years. The exceptions, at least from these storms, are far southern TX (offshore winds during Harvey), MS/AL/far western FL (though some surge was observed during Nate in 2017), and the Tampa area.
The last major impact to examine was rainfall.
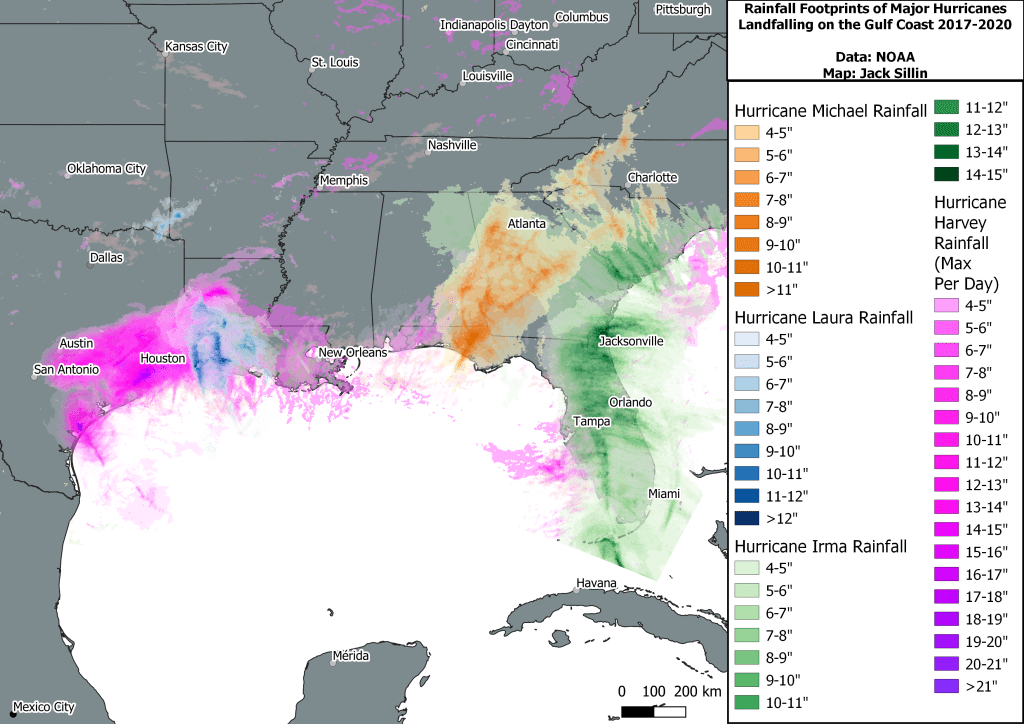
I’m not overly excited about how this map turned out since it uses daily precipitation data for the whole country as opposed to a storm total map for each system. For fast-moving storms like Michael or Laura, where most of the rain that falls in any given area comes in one day, this methodology does a decent job showing the storm’s rain swath. But for slower-moving storms like Irma or especially Harvey, getting a smooth depiction of storm total rainfall is darn near impossible. At least with my yet-limited mapmaking knowledge. I’ve been told there are ways to add up various daily datasets to get a storm total dataset then clip the data to only focus on rain that fell during any given storm. Projects for another day!
Most of the GIS knowledge I used to make these maps comes from Dennis Mersereau’s excellent introduction to mapmaking in QGIS.
-Jack
